Turbines Generate Electricity
Explore each component →
Source: ENEC Secondary Loop Components, 2024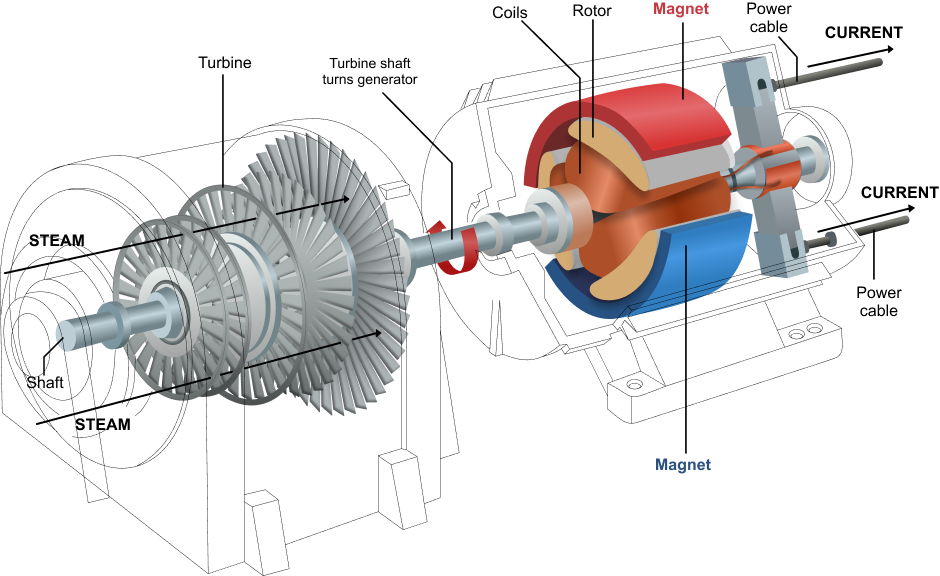
America's Biggest Technological Bottleneck
Energy is not a climate change issue, it is a national security issue.
Key Takeaways:
The grid is the backbone of America's prosperity and potential. To grasp the challenges faced, we need to understand what it is and how it works.
America's electric grid is an interconnected network of power lines and components that generate, store, and transmit electricity from power plants and batteries to homes, businesses, and critical infrastructure.Source: U.S. Energy Information Administration
Explore each component →
Source: ENEC Secondary Loop Components, 2024
Explore each component →
Grid frequency is nominal. Supply and demand are balanced.
Hover a box to see its connections
The grid is the backbone of any nation state that aspires to technological leadership.
The U.S. grid is in critical condition.
The AI race is fundamentally an energy race.